Histogram Reading for Milky Way Shots
```html
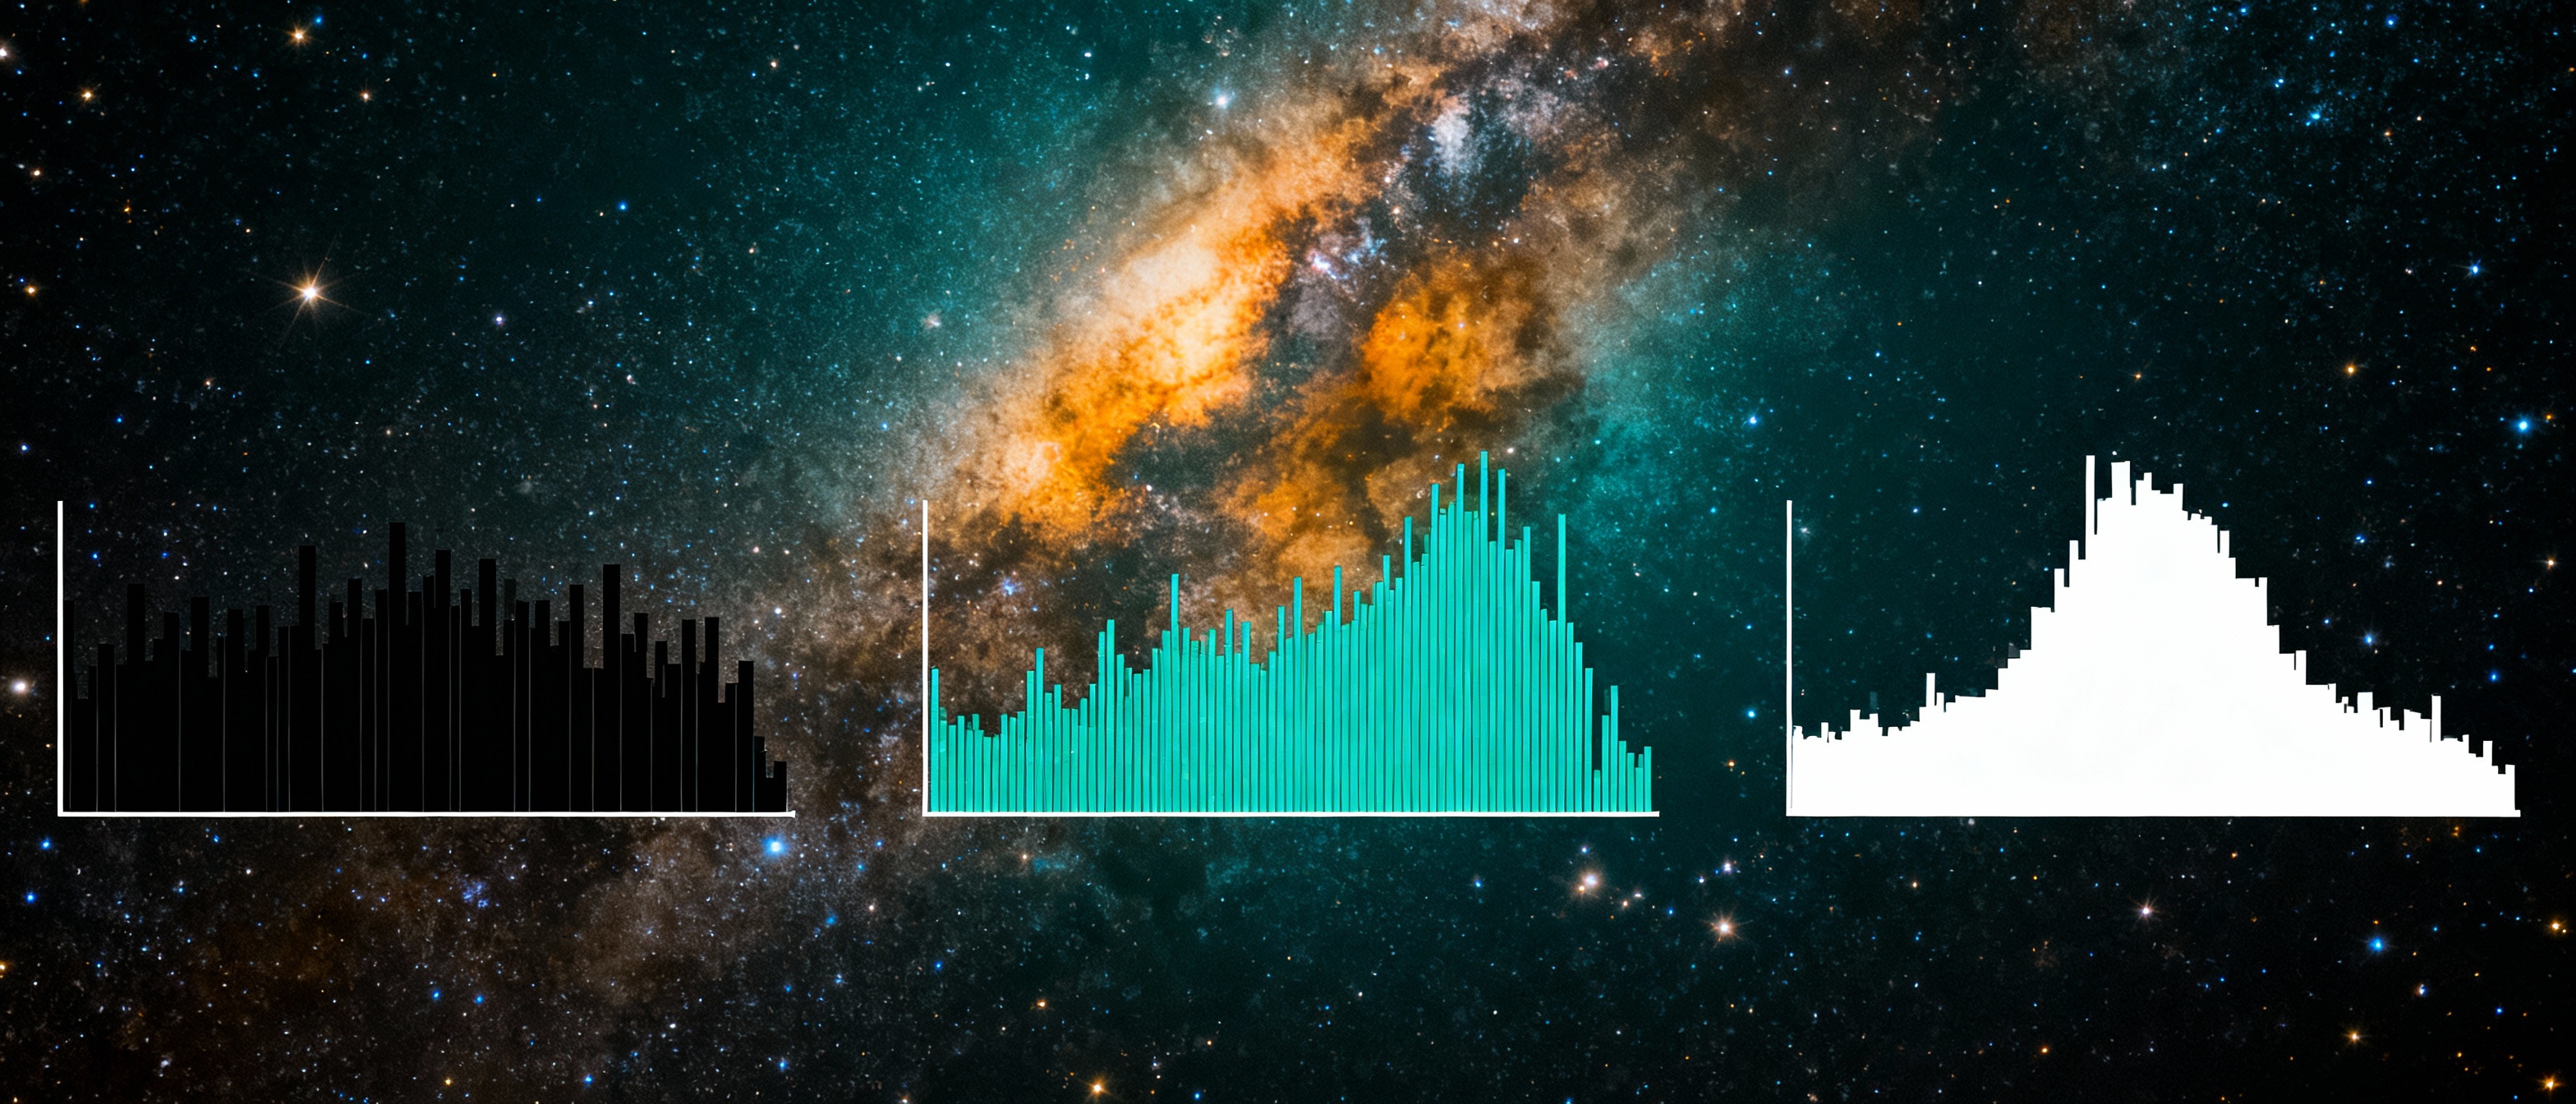
Understanding Histograms: A Crucial Tool for Milky Way Photography
Capturing the Milky Way requires more than just a camera and a dark sky—it demands a deep understanding of technical tools like histograms. A histogram is a graphical representation of the tonal distribution in an image, mapping shadows (left), midtones (center), and highlights (right). For Milky Way photography, where lighting conditions are extreme, the histogram becomes your compass. Without it, you risk underexposing faint stars or blowing out the galactic core. By analyzing the histogram, you can balance noise and detail, ensuring your final image reflects the awe-inspiring beauty of the night sky.
Interpreting Histogram Shapes for Galactic Clarity
Not all histograms are created equal. For Milky Way shots, the ideal histogram often skews toward the left (shadows) but avoids clipping. A "healthy" histogram will show a gentle slope rising from the shadows to a peak near the midtones, reflecting the dark sky and the galaxy’s brighter regions. If the graph is slammed against the left edge, your image is underexposed, burying star details in noise. If it spills too far right, the Milky Way's delicate filaments may appear washed out. Learning to distinguish these patterns helps you adjust settings like ISO, shutter speed, and aperture in real time.
Camera Settings and Their Impact on the Histogram
Your camera’s trio—ISO, aperture, and shutter speed—directly shapes the histogram. A wide aperture (f/2.8 or lower) pulls more starlight into the sensor, pushing the histogram toward the midtones. However, this can introduce vignetting. A high ISO (3200–6400) brightens the image but risks noise in the shadows, visible as a "spiky" left side. Shutter speed walks a tightrope: too long (over 25–30 seconds), and stars begin to trail, smearing fine details. Adjust one setting at a time while monitoring the histogram’s response to maintain equilibrium between detail retention and noise control.
Common Histogram Pitfalls and How to Avoid Them
Even seasoned astrophotographers face histogram traps. One frequent mistake is chasing a "perfectly centered" histogram, which often overexposes the sky. Instead, aim for a right-leaning histogram without clipping (Expose to the Right—ETTR) to maximize data in RAW files. Another pitfall is ignoring color channels: the Milky Way’s red and blue nebulae can cause channel-specific clipping, which a luminance histogram alone won’t reveal. Use your camera’s RGB histogram mode to detect and correct this. Lastly, avoid over-correcting in post-processing; pushing shadows too hard amplifies noise, unraveling the histogram’s careful balance.
Workflow: From Capturing to Post-Processing
Start by taking test shots and checking the histogram in-camera. Adjust ISO or shutter speed until the graph nestles just shy of the right edge. Once home, use tools like Adobe Lightroom’s histogram to guide your edits. Boost exposure cautiously, and leverage the histogram’s clipping warnings to recover highlights (like starlight) or lift shadows (foreground details). Noise reduction sliders can smooth the shadow regions, but overuse will soften the Milky Way’s texture. Pair this with localized adjustments—gradient filters for the sky, brushes for specific stars—to honor the histogram’s story while enhancing visual impact.